
Criticism via Sleight of HandDavid C. Berliner
Hanushek, Peterson and Woessmann (2014) (HPW) criticize Berliner, Glass, and Associates (2014). They label Berliner et al. “apologists,” and as misleaders of the American people. But their critique of our work seems bizarre. They never address the issue we deal with. We talk about the role of income and poverty in national and international assessments. They do not. Here is what they do: “To ascertain whether the challenges facing the United States are concentrated among the educationally disadvantaged, we identify for each state and country the proficiency rate of students from families with parents of high, moderate, and low levels of education.”
Their analysis suggests that the children of America’s better educated families do not do as well as the children of better educated parents in other countries. If true, that would certainly not make us happy. But it is an irrelevant criticism of our analysis which convincingly demonstrates that poverty, along with its sequelae and correlations, is the greatest barrier to high achievement test scores for U.S. students on both domestic and international tests. Theirs is criticism via sleight of hand—we talk “level of poverty” and the outcomes of assessments, they talk “level of parental education” and the outcomes of assessment.
Everyone knows that there is a relationship between educational level and income. But HPW blithely assume that the correlation between these two variables is quite high, when it is not. In fact the raw correlation between an individual’s educational level and that individual’s income actually is surprisingly low. In Arizona, for example, among employed individuals 25-55 years old, the correlations between wage income and education level are about .20 for workers at younger ages, the child-bearing ages. This correlation increases with age, but is still relatively weak, only about .40 (accounting for only 16% of variance) at the upper end of the age scale examined. One’s level of education and one’s level of income simply do not provide the same information, something often referred to as status inconsistency in the sociological literature.
To criticize us with their data set requires HPW to show two things. First, that the correlation between educational level of the parents of school children and income level of those parents is quite high in the U.S. Second, they must show that the relationships of parental education and parental income is about the same in all the OECD countries. They do not provide either of these two analyses. Nor could they, since it is highly unlikely that similar correlations are the case.
Moreover, HPW do not acknowledge that much recent data suggest that education and income are not highly correlated in the U.S. For example, we know that in 1970, only 1 in 100 taxi drivers and chauffeurs in the U.S. had a college degree. Today, 15 of 100 do. Highly educated taxi drivers are likely not to be able to afford to live in the areas where school poverty rates for families are below 10%. In those public schools, U.S. students are among the top scoring in the world. Even in the schools where about 10-25% of the families are in poverty, U.S. public school students compete remarkably well. The question is whether all those well-educated taxi drivers live in the areas served by those kinds of school? Probably not! Thus their children are unlikely to be getting as good an education as are the children whose parents, regardless of their educational level, can afford to live in those areas.
Educational achievement on domestic and international tests is related to where you live and with whom you go to school. The children of these well-educated taxi drivers are more likely living in schools attended by people of more modest means, and this is possibly a reason for the findings of HPW. But it is not just taxi drivers with college degrees that have grown in numbers. In 1970, only about 2 percent of firefighters had a college degree. Now 15 percent do. Are they sending their kids to the schools attended by richer Americans, or to schools that serve the working and middle classes?
About 1 in 4 bartenders has some sort of college degree. Are they high earners? If they have children, with whom would those children go to school? Our critics know as well as we do that who you go to school with is more important for your performance on tests than is your teacher, or any other influence. James Coleman made that clear fifty years ago and no credible refutation of this argument yet exists.
So if many of America’s highly educated people are not earning high salaries, and thus not sending their children to the schools attended by the children of the advantaged, guess what? They will not do as well as might be expected of highly educated people—which is the point made by HPW. So not only does their data not refute our argument, if our hypothesis about education and income in contemporary U.S. is credible, their data actually confirm ours! Parental income and their child’s school achievement are strongly related, perhaps even more so than is parental education level and their children’s school achievement. In modern America, parental income rather than parental education more often determines who your children go to school with.
Even more evidence suggests that the correlation between education and income (and therefore, the correlation between education and the neighborhood one lives in) is not as high as HPW suggest. More than a third of recent college graduates hold jobs that do not require a college degree. This underemployment or "mal-employment" rate appears to be over 36% for college-educated workers younger than 25. People don't go to college to be a waiter or a bartender, but that is now a common outcome of their education. Nearly 8% of college graduates are working part-time, but would like full-time positions, and these highly educated people are not counted in the mal-employment rate of 36%.
Not surprisingly, hospitality and retail are the most common occupations of the mal-employed. Of the nearly 3 million recent college grads, 152,000 are working in retail sales and nearly 100,000 work as waiters, bartenders or in other food service posts. Another 80,000 serve as clerks or customer service representatives, and 60,000 work in construction or manual labor. These are Americans of child-bearing age, and they will be sending their children to school now, or quite soon. Will they live in neighborhoods where less than 10% of the families served by the schools are in poverty? Or are these now and future parents more likely to live in neighborhoods where 25-50% of the families are in poverty? Those would be the neighborhoods and schools that serve the working and the middle classes, and the students in these schools score about the national or international average on most assessments. Not great, but certainly not bad. Furthermore, going to the suburbs is no escape: Recently, and for the first time, suburban poverty rates exceeded urban poverty rates. So these poor and modest-earning well-educated Americans, often with large debts from college, are likely to wait a long time before they can move to a neighborhood with a school that has less than 10% of its children living in poverty and thus a likely very high performing school.
As is clear, HPW switched the argument from poverty to education. Perhaps children of America’s highly educated parents are not doing as well as children of the highly educated in other countries. We did not study that issue, but we have doubts about their findings, given what we have presented above about the relationship between education and income and where children are likely to be brought up in the contemporary U.S. More important is that their argument is irrelevant to our argument. We are quite sure we are correct in stating that youth poverty is our biggest education problem (see also, Biddle (2014)). What follows is why we hold this belief. On the Trends in International Mathematics and Science Study [TIMSS] tests, on the Progress in International Reading Literacy Study [PIRLS] test, and on the Program for International Student Assessment [PISA] tests of reading, science and mathematics, public school students in five groups were assessed. One group attended schools where fewer than 10% of the families were in poverty, others attended schools where approximately 10-25% of the families were in poverty, or where 25-50%, 50-75% or over 75% of the families served by the school were in poverty. On each of these three international tests, U.S. public school students did terrific in the schools where poverty rates of families were under 10%, or even when poverty rates were between 10% and 25%. But we did not do well in schools where poverty rates were above 50%, and we did even worse on those tests in schools where poverty rates for families were in the 75-100% bracket.
Here is the recent TIMSS data for grades 4 and 8 by poverty of the families served by the school.
Although many nations in this analysis were not developed nations, the competition did include Singapore, Korea, Hong Kong, and many OECD countries. The data are clear. First, to the amazement of everyone, the U.S. mean score in mathematics was above the international average, a finding conveniently underreported in the U.S. But averages always hide trends in data. When U.S. scores are broken down by the poverty of the families served, as in this graph, we see that the higher the percent of poverty among the families served by the schools, the lower the score in math. The science assessment showed the same trend. Less well known is that the two groups on the left constitute about 12 million students, and they handily beat the average score of Finland. Even the middle group beat Finland at both the 4th and 8th grade, and that means that about 50% of U.S. school children who are not greatly affected by poverty, about 25 million children, are doing as well as the nation whose scores other nations envy. But internationally high, or quite respectable test scores, are not the lot of those students attending schools with high rates of poverty. That is our simple point. Let’s switch to PIRLS.
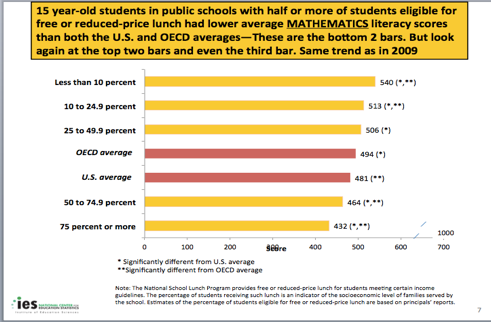
U.S. public school students, where poverty rates were low, the two bars on the left, outscored every other nation in the world, and there were more than 50 other countries and jurisdictions in this study. Underreported, once again, was that even our children in schools that serve the poorest families, the bar on the right, scored above the international average. The gap, however, between the children in schools that serve the wealthy and those that serve the poor is huge. That is our point. If we want better test scores in the U.S. we should probably stop blaming unions, tenure, the curriculum, teachers and administrators, and instead create programs to reduce poverty and the housing segregation that accompanies low earnings. Now let’s go to PISA, the test that HPW use to argue that we do not have it right. Here are math scores for the five groups we focus on.
Even in math, often our weakest subject, those students in schools where poverty rarely is seen, the first bar in this graph, placed 6th in world—and they placed higher than Japan. The next group, schools with less than 25% of the children living in poverty families, placed 17th in world, well above most of the countries in OECD. But here is our national problem: The U.S. average score was low because the schools attended by children whose families are in poverty score poorly. Those in the schools most heavily affected by poverty may not have the mathematics skills needed to compete in the market. But other U.S. children certainly do, and they are predominantly those attending schools low in family poverty.
Here are science scores.
The first bar in this graph displays PISA science scores for students in schools with under 10% of their classmates living in families that experience poverty. They were beaten by only one country, Shanghai, which as we know is not a country but a city. And it is a city with the highest rate of college graduates in China. Apparently it also does not test the children of its illegal immigrants (those from rural areas living in Shanghai illegally: Their number may approach 200,000). The second bar, representing students in schools where under 25% of the students are from families in poverty tied for 8th in the world. Not too shabby a performance for about 12 million American public school students. But once again the trend is clear. Children in schools high in poverty do not do well. The difference between the schools serving the wealthy and the poor is over one standard deviation.
Here is the reading data. The trend is clear once again.
Reading is an area of US strength, as PIRLS revealed. We see that again in PISA. US students in schools where under 10% of the families served are in poverty placed 2nd in the world. In the group where under 25% of the students were in poverty the students placed 6th in the world, tied with Finland. So, again, around 12 million of our student’s did great. And if we assess the performance of students represented by the third bar, the one showing students in schools with 25-50% of the families served in poverty, they also did well. They came in 10th. So approximately half of all US students, about 25 million of them, are doing pretty good, but that is not true for the other half of our school population—those attending schools where over 50% of the students come from families that are eligible for free and reduced lunch, our marker of family poverty.
We conclude that in contemporary America parental income, not parental education buys neighborhood, and neighborhood plays a big role in determining the composition of the class ones child is in, the composition of the cohort at the grade level one’s child is in, and the characteristics of the community in which one’s child goes to school. If there is not a very strong correlation between parental education and parental income, or more to the point, between parental education and where you can afford to live, HPW are wrong in both their interpretation of their own data, and their criticism of us. But we would like to add one more criticism of HPW, namely, that reliance on PISA and other international assessments to draw conclusions about characteristics of the U.S. system of education is foolish, even though we challenged their interpretations of our work by using those same questionable tests. The remarkably insightful Chinese born scholar Yong Zhao has a book coming out soon (Zhou, 2014). In it he makes it quite clear that PISA, in particular, and for international tests in general, it is impossible to draw valid conclusions about the strengths and weaknesses of national systems of education. Zhao (and many others) would caution, and we would agree, that HPW are on extremely shaky ground when they use PISA data to do so.
References
Berliner, D. C., Glass, G. V and Associates. (2014). Fifty myths and lies that threaten America’s public schools. New York: Teachers College Press.
Biddle, B. J. (2014). The unacknowledged disaster: Youth poverty and educational failure in America. Boston. MA: Sense Publishers.
Hanushek, E. A., Peterson, P. E., & Woessmann, L. (2014). Not just the problems of other people’s children: U.S. Student Performance in Global Perspective. Harvard University, Program on Education Policy and Governance & Education Next, PEPG Report No. 14-01, May 2014.
Zhao, Y. (2014). Who’s afraid of the big bad dragon? Why China has the best (and worst) education system in the world. San Francisco, CA: Jossey- Bass.


Gene V Glass
Arizona State University
National Education Policy Center
University of Colorado Boulder
The opinions expressed here are those of the author and do not represent the official position of NEPC, Arizona State University, nor the University of Colorado Boulder.
No comments:
Post a Comment